Logistic regression model#
Procedure:
Example: Alzheimers mass spectrometry-based proteomics dataset
Predict Alzheimer disease based on proteomics measurements.
# Setup colab installation
# You need to restart the runtime after running this cell
%pip install njab heatmapz openpyxl plotly umap-learn
Set parameters#
CLINIC: str = (
    "https://raw.githubusercontent.com/RasmussenLab/njab/HEAD/docs/tutorial/data/alzheimer/clinic_ml.csv"  # clincial data
)
fname_omics: str = (
    "https://raw.githubusercontent.com/RasmussenLab/njab/HEAD/docs/tutorial/data/alzheimer/proteome.csv"  # omics data
)
TARGET: str = "AD"  # target column in CLINIC dataset (binary)
TARGET_LABEL: Optional[str] = None  # optional: rename target variable
n_features_max: int = 5
freq_cutoff: float = 0.5  # Omics cutoff for sample completeness
VAL_IDS: str = ""  #
VAL_IDS_query: str = ""
weights: bool = True
FOLDER = "alzheimer"
model_name = "all"
Setup#
Load data#
clinic = pd.read_csv(CLINIC, index_col=0).convert_dtypes()
cols_clinic = njab.pandas.get_colums_accessor(clinic)
omics = pd.read_csv(fname_omics, index_col=0)
Data shapes
omics.shape, clinic.shape
((210, 1542), (210, 6))
See how common omics features are and remove feature below choosen frequency cutoff
ax = omics.notna().sum().sort_values().plot(rot=45)
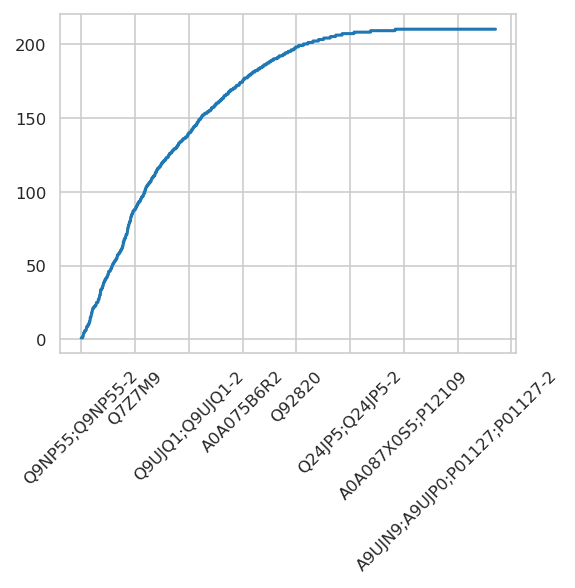
Removed 248 features with more than 50.0% missing values.
Remaining features: 1294 (of 1542)
| A0A024QZX5 | A0A024R0T9 | A0A024R3W6 | A0A024R644 | A0A075B6H9 | A0A075B6I0 | A0A075B6I1 | A0A075B6I6 | A0A075B6I9 | A0A075B6J9 | ... | Q9Y653 | Q9Y696 | Q9Y6C2 | Q9Y6N6 | Q9Y6N7 | Q9Y6R7 | Q9Y6X5 | Q9Y6Y8 | Q9Y6Y9 | S4R3U6 | |
|---|---|---|---|---|---|---|---|---|---|---|---|---|---|---|---|---|---|---|---|---|---|
| Sample ID | |||||||||||||||||||||
| Sample_000 | 15.912 | 16.852 | 15.571 | 16.481 | 20.246 | 16.764 | 17.584 | 16.988 | 20.054 | NaN | ... | 16.012 | 15.178 | NaN | 15.050 | 16.842 | 19.863 | NaN | 19.563 | 12.838 | 12.805 |
| Sample_001 | 15.936 | 16.874 | 15.519 | 16.387 | 19.941 | 18.786 | 17.144 | NaN | 19.067 | 16.188 | ... | 15.528 | 15.576 | NaN | 14.833 | 16.597 | 20.299 | 15.556 | 19.386 | 13.970 | 12.443 |
| Sample_002 | 16.112 | 14.523 | 15.935 | 16.416 | 19.251 | 16.832 | 15.671 | 17.012 | 18.569 | NaN | ... | 15.229 | 14.728 | 13.757 | 15.118 | 17.440 | 19.598 | 15.735 | 20.447 | 12.637 | 12.505 |
| Sample_003 | 16.107 | 17.032 | 15.802 | 16.979 | 19.628 | 17.852 | 18.877 | 14.182 | 18.985 | 13.438 | ... | 15.495 | 14.590 | 14.682 | 15.140 | 17.356 | 19.429 | NaN | 20.216 | 12.627 | 12.445 |
| Sample_004 | 15.603 | 15.331 | 15.375 | 16.679 | 20.450 | 18.682 | 17.081 | 14.140 | 19.686 | 14.495 | ... | 14.757 | 15.094 | 14.048 | 15.256 | 17.075 | 19.582 | 15.328 | 19.867 | 13.145 | 12.235 |
| ... | ... | ... | ... | ... | ... | ... | ... | ... | ... | ... | ... | ... | ... | ... | ... | ... | ... | ... | ... | ... | ... |
| Sample_205 | 15.682 | 16.886 | 14.910 | 16.482 | 17.705 | 17.039 | NaN | 16.413 | 19.102 | 16.064 | ... | 15.236 | 15.684 | 14.236 | 15.415 | 17.551 | 17.922 | 16.340 | 19.928 | 12.930 | 11.803 |
| Sample_206 | 15.798 | 17.554 | 15.600 | 15.938 | 18.155 | 18.152 | 16.503 | 16.860 | 18.538 | 15.288 | ... | 15.422 | 16.106 | NaN | 15.345 | 17.084 | 18.708 | 14.249 | 19.433 | NaN | NaN |
| Sample_207 | 15.740 | 16.877 | 15.469 | 16.898 | 18.636 | 17.950 | 16.321 | 16.401 | 18.849 | 17.580 | ... | 15.808 | 16.098 | 14.403 | 15.715 | 16.586 | 18.725 | 16.138 | 19.599 | 13.637 | 11.174 |
| Sample_208 | 15.477 | 16.779 | 14.995 | 16.132 | 14.908 | 17.530 | NaN | 16.119 | 18.368 | 15.202 | ... | 15.157 | 16.712 | NaN | 14.640 | 16.533 | 19.411 | 15.807 | 19.545 | 13.216 | NaN |
| Sample_209 | 15.727 | 17.261 | 15.175 | 16.235 | 17.893 | 17.744 | 16.371 | 15.780 | 18.806 | 16.532 | ... | 15.237 | 15.652 | 15.211 | 14.205 | 16.749 | 19.275 | 15.732 | 19.577 | 11.043 | 11.792 |
210 rows × 1294 columns
Clinical data#
View clinical data
clinic
| Kiel | Magdeburg | Sweden | male | age | AD | |
|---|---|---|---|---|---|---|
| Sample ID | ||||||
| Sample_000 | 0 | 0 | 1 | 0 | 71 | 0 |
| Sample_001 | 0 | 0 | 1 | 1 | 77 | 1 |
| Sample_002 | 0 | 0 | 1 | 1 | 75 | 1 |
| Sample_003 | 0 | 0 | 1 | 0 | 72 | 1 |
| Sample_004 | 0 | 0 | 1 | 0 | 63 | 1 |
| ... | ... | ... | ... | ... | ... | ... |
| Sample_205 | 0 | 0 | 0 | 0 | 69 | 1 |
| Sample_206 | 0 | 0 | 0 | 1 | 73 | 0 |
| Sample_207 | 0 | 0 | 0 | 0 | 71 | 0 |
| Sample_208 | 0 | 0 | 0 | 1 | 83 | 0 |
| Sample_209 | 0 | 0 | 0 | 0 | 63 | 0 |
210 rows × 6 columns
Target#
Tabulate target and check for missing values
njab.pandas.value_counts_with_margins(clinic[TARGET])
| counts | prop | |
|---|---|---|
| AD | ||
| 0 | 122 | 0.581 |
| 1 | 88 | 0.419 |
if TARGET_LABEL is None:
    TARGET_LABEL = TARGET
y = clinic[TARGET].rename(TARGET_LABEL).astype(int)
clinic_for_ml = clinic.drop(TARGET, axis=1)
Test IDs#
Select some test samples:
WARNING:root:Create train and test split.
['Sample_127',
 'Sample_164',
 'Sample_175',
 'Sample_048',
 'Sample_159',
 'Sample_141',
 'Sample_174',
 'Sample_145',
 'Sample_090',
 'Sample_191',
 'Sample_038',
 'Sample_009',
 'Sample_112',
 'Sample_096',
 'Sample_146',
 'Sample_135',
 'Sample_142',
 'Sample_205',
 'Sample_186',
 'Sample_095',
 'Sample_085',
 'Sample_011',
 'Sample_156',
 'Sample_153',
 'Sample_124',
 'Sample_194',
 'Sample_061',
 'Sample_079',
 'Sample_149',
 'Sample_179',
 'Sample_197',
 'Sample_125',
 'Sample_133',
 'Sample_099',
 'Sample_067',
 'Sample_202',
 'Sample_010',
 'Sample_171',
 'Sample_018',
 'Sample_060',
 'Sample_185',
 'Sample_173']
Combine clinical and olink data#
# in case you need to subselect
feat_to_consider = clinic_for_ml.columns.to_list()
feat_to_consider += omics.columns.to_list()
feat_to_consider
View data for training
| Kiel | Magdeburg | Sweden | male | age | A0A024QZX5 | A0A024R0T9 | A0A024R3W6 | A0A024R644 | A0A075B6H9 | ... | Q9Y653 | Q9Y696 | Q9Y6C2 | Q9Y6N6 | Q9Y6N7 | Q9Y6R7 | Q9Y6X5 | Q9Y6Y8 | Q9Y6Y9 | S4R3U6 | |
|---|---|---|---|---|---|---|---|---|---|---|---|---|---|---|---|---|---|---|---|---|---|
| Sample ID | |||||||||||||||||||||
| Sample_000 | 0 | 0 | 1 | 0 | 71 | 15.912 | 16.852 | 15.571 | 16.481 | 20.246 | ... | 16.012 | 15.178 | NaN | 15.050 | 16.842 | 19.863 | NaN | 19.563 | 12.838 | 12.805 |
| Sample_001 | 0 | 0 | 1 | 1 | 77 | 15.936 | 16.874 | 15.519 | 16.387 | 19.941 | ... | 15.528 | 15.576 | NaN | 14.833 | 16.597 | 20.299 | 15.556 | 19.386 | 13.970 | 12.443 |
| Sample_002 | 0 | 0 | 1 | 1 | 75 | 16.112 | 14.523 | 15.935 | 16.416 | 19.251 | ... | 15.229 | 14.728 | 13.757 | 15.118 | 17.440 | 19.598 | 15.735 | 20.447 | 12.637 | 12.505 |
| Sample_003 | 0 | 0 | 1 | 0 | 72 | 16.107 | 17.032 | 15.802 | 16.979 | 19.628 | ... | 15.495 | 14.590 | 14.682 | 15.140 | 17.356 | 19.429 | NaN | 20.216 | 12.627 | 12.445 |
| Sample_004 | 0 | 0 | 1 | 0 | 63 | 15.603 | 15.331 | 15.375 | 16.679 | 20.450 | ... | 14.757 | 15.094 | 14.048 | 15.256 | 17.075 | 19.582 | 15.328 | 19.867 | 13.145 | 12.235 |
| ... | ... | ... | ... | ... | ... | ... | ... | ... | ... | ... | ... | ... | ... | ... | ... | ... | ... | ... | ... | ... | ... |
| Sample_205 | 0 | 0 | 0 | 0 | 69 | 15.682 | 16.886 | 14.910 | 16.482 | 17.705 | ... | 15.236 | 15.684 | 14.236 | 15.415 | 17.551 | 17.922 | 16.340 | 19.928 | 12.930 | 11.803 |
| Sample_206 | 0 | 0 | 0 | 1 | 73 | 15.798 | 17.554 | 15.600 | 15.938 | 18.155 | ... | 15.422 | 16.106 | NaN | 15.345 | 17.084 | 18.708 | 14.249 | 19.433 | NaN | NaN |
| Sample_207 | 0 | 0 | 0 | 0 | 71 | 15.740 | 16.877 | 15.469 | 16.898 | 18.636 | ... | 15.808 | 16.098 | 14.403 | 15.715 | 16.586 | 18.725 | 16.138 | 19.599 | 13.637 | 11.174 |
| Sample_208 | 0 | 0 | 0 | 1 | 83 | 15.477 | 16.779 | 14.995 | 16.132 | 14.908 | ... | 15.157 | 16.712 | NaN | 14.640 | 16.533 | 19.411 | 15.807 | 19.545 | 13.216 | NaN |
| Sample_209 | 0 | 0 | 0 | 0 | 63 | 15.727 | 17.261 | 15.175 | 16.235 | 17.893 | ... | 15.237 | 15.652 | 15.211 | 14.205 | 16.749 | 19.275 | 15.732 | 19.577 | 11.043 | 11.792 |
210 rows × 1299 columns
Data Splits#
Separate train and test split
Output folder#
Output folder: alzheimer
Outputs#
Save outputs to excel file:
Excel-file for tables: alzheimer/log_reg.xlsx
Collect test predictions#
predictions = y_val.to_frame("true")
Fill missing values with training median#
age          10
A0A024QZX5   11
A0A024R0T9    2
A0A024R3W6   23
A0A024R644    1
             ..
Q9Y6N6        6
Q9Y6N7       10
Q9Y6X5       22
Q9Y6Y9       70
S4R3U6       65
Length: 894, dtype: int64
| age | A0A024QZX5 | A0A024R0T9 | A0A024R3W6 | A0A024R644 | A0A075B6H9 | A0A075B6I0 | A0A075B6I1 | A0A075B6I6 | A0A075B6J9 | ... | Q9Y5I4 | Q9Y617 | Q9Y653 | Q9Y696 | Q9Y6C2 | Q9Y6N6 | Q9Y6N7 | Q9Y6X5 | Q9Y6Y9 | S4R3U6 | |
|---|---|---|---|---|---|---|---|---|---|---|---|---|---|---|---|---|---|---|---|---|---|
| Sample ID | |||||||||||||||||||||
| Sample_000 | 71 | 15.912 | 16.852 | 15.571 | 16.481 | 20.246 | 16.764 | 17.584 | 16.988 | NaN | ... | 17.187 | 16.859 | 16.012 | 15.178 | NaN | 15.050 | 16.842 | NaN | 12.838 | 12.805 |
| Sample_001 | 77 | 15.936 | 16.874 | 15.519 | 16.387 | 19.941 | 18.786 | 17.144 | NaN | 16.188 | ... | 17.447 | 16.799 | 15.528 | 15.576 | NaN | 14.833 | 16.597 | 15.556 | 13.970 | 12.443 |
| Sample_002 | 75 | 16.112 | 14.523 | 15.935 | 16.416 | 19.251 | 16.832 | 15.671 | 17.012 | NaN | ... | 17.410 | 16.288 | 15.229 | 14.728 | 13.757 | 15.118 | 17.440 | 15.735 | 12.637 | 12.505 |
| Sample_003 | 72 | 16.107 | 17.032 | 15.802 | 16.979 | 19.628 | 17.852 | 18.877 | 14.182 | 13.438 | ... | 17.545 | 17.075 | 15.495 | 14.590 | 14.682 | 15.140 | 17.356 | NaN | 12.627 | 12.445 |
| Sample_004 | 63 | 15.603 | 15.331 | 15.375 | 16.679 | 20.450 | 18.682 | 17.081 | 14.140 | 14.495 | ... | 17.297 | 16.736 | 14.757 | 15.094 | 14.048 | 15.256 | 17.075 | 15.328 | 13.145 | 12.235 |
| ... | ... | ... | ... | ... | ... | ... | ... | ... | ... | ... | ... | ... | ... | ... | ... | ... | ... | ... | ... | ... | ... |
| Sample_204 | <NA> | NaN | 17.279 | 15.287 | 16.513 | 20.183 | 19.674 | 20.251 | 16.334 | 19.778 | ... | 15.874 | 15.465 | 15.668 | 15.915 | 14.204 | 15.025 | NaN | 15.012 | 12.288 | 10.564 |
| Sample_206 | 73 | 15.798 | 17.554 | 15.600 | 15.938 | 18.155 | 18.152 | 16.503 | 16.860 | 15.288 | ... | 17.109 | 15.035 | 15.422 | 16.106 | NaN | 15.345 | 17.084 | 14.249 | NaN | NaN |
| Sample_207 | 71 | 15.740 | 16.877 | 15.469 | 16.898 | 18.636 | 17.950 | 16.321 | 16.401 | 17.580 | ... | 16.938 | 16.283 | 15.808 | 16.098 | 14.403 | 15.715 | 16.586 | 16.138 | 13.637 | 11.174 |
| Sample_208 | 83 | 15.477 | 16.779 | 14.995 | 16.132 | 14.908 | 17.530 | NaN | 16.119 | 15.202 | ... | 17.155 | 15.920 | 15.157 | 16.712 | NaN | 14.640 | 16.533 | 15.807 | 13.216 | NaN |
| Sample_209 | 63 | 15.727 | 17.261 | 15.175 | 16.235 | 17.893 | 17.744 | 16.371 | 15.780 | 16.532 | ... | 16.776 | 15.713 | 15.237 | 15.652 | 15.211 | 14.205 | 16.749 | 15.732 | 11.043 | 11.792 |
168 rows × 894 columns
Impute using median of training data
median_imputer = sklearn.impute.SimpleImputer(strategy="median")

X = njab.sklearn.transform_DataFrame(X, median_imputer.fit_transform)
X_val = njab.sklearn.transform_DataFrame(X_val, median_imputer.transform)
assert X.isna().sum().sum() == 0
X.shape, X_val.shape
((168, 1299), (42, 1299))
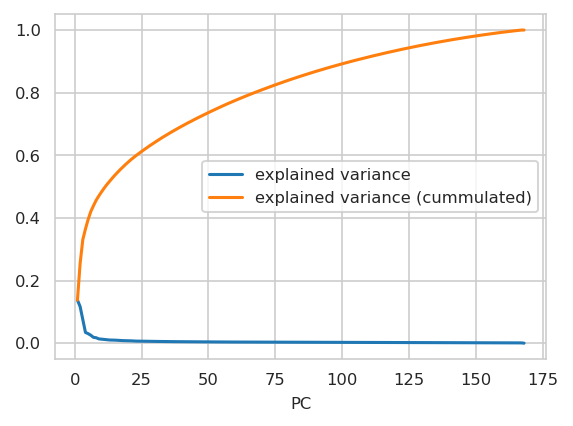
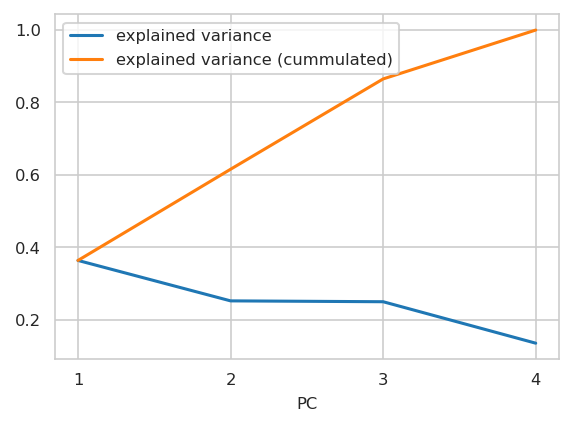
Principal Components#
on standard normalized training data:
INFO:njab.plotting:Saved Figures to alzheimer/var_explained_by_PCs.png
INFO:njab.plotting:Saved Figures to alzheimer/var_explained_by_PCs.pdf
(168, 1299)
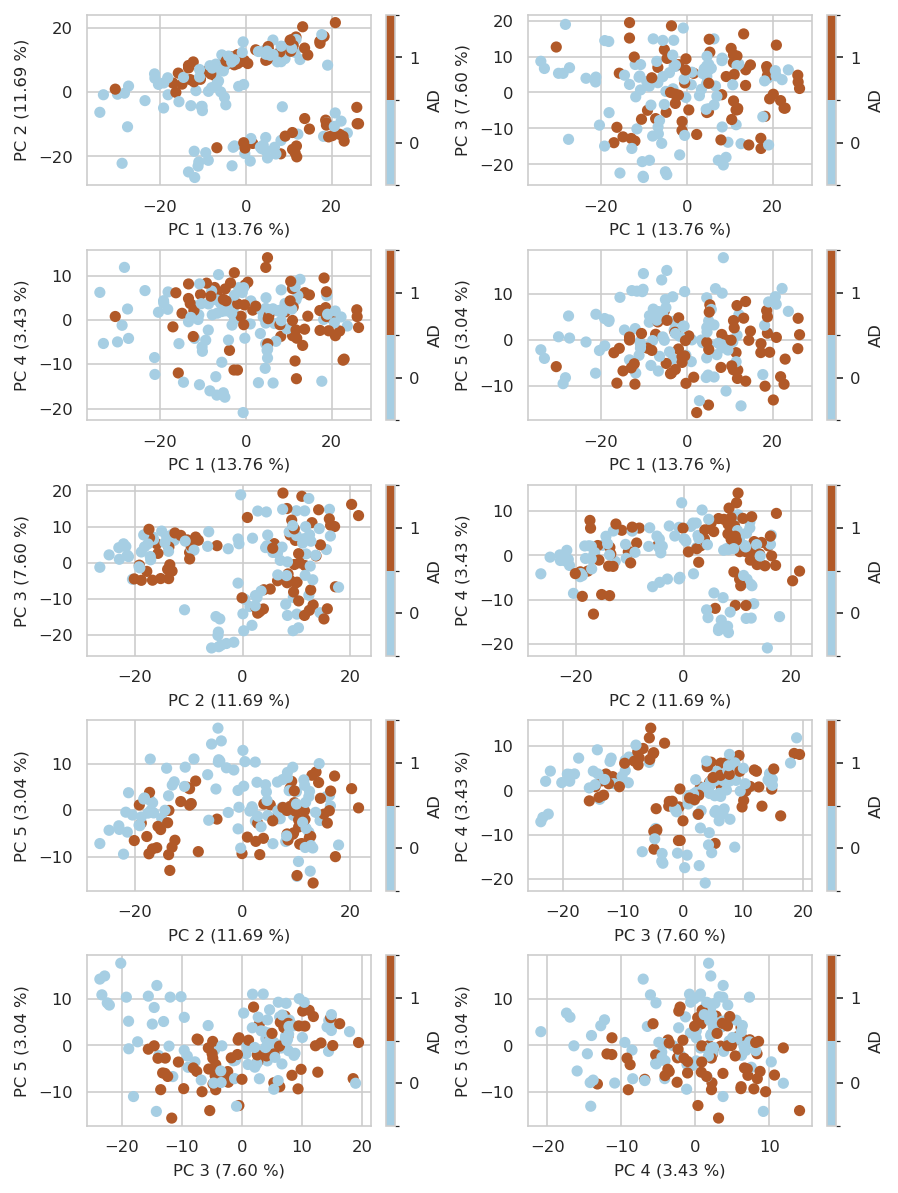
Plot first 5 PCs with binary target label annotating each sample::
INFO:njab.plotting:Saved Figures to alzheimer/scatter_first_5PCs.png
INFO:njab.plotting:Saved Figures to alzheimer/scatter_first_5PCs.pdf
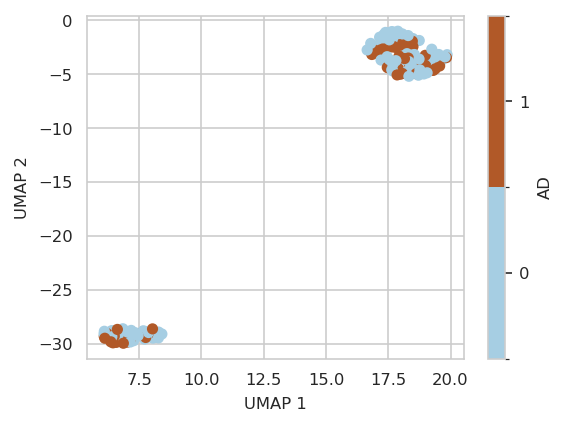
UMAP#
of training data:
INFO:njab.plotting:Saved Figures to alzheimer/umap.png
INFO:njab.plotting:Saved Figures to alzheimer/umap.pdf
Baseline Model - Logistic Regression#
Based on parameters, use weighting:
if weights:
    weights = "balanced"
    cutoff = 0.5
else:
    cutoff = None
    weights = None
Logistic Regression#
Procedure:
Select best set of features from entire feature set selected using CV on train split
Retrain best model configuration using entire train split and evalute on test split
Define splits and models:
splits = Splits(
    X_train=X_scaled, X_test=scaler.transform(X_val), y_train=y, y_test=y_val
)
model = sklearn.linear_model.LogisticRegression(penalty="l2", class_weight=weights)
  0%|          | 0/1 [00:00<?, ?it/s]
100%|██████████| 1/1 [00:00<00:00, 285.87it/s]
  0%|          | 0/2 [00:00<?, ?it/s]
100%|██████████| 2/2 [00:00<00:00, 21.35it/s]
  0%|          | 0/3 [00:00<?, ?it/s]
100%|██████████| 3/3 [00:00<00:00, 16.47it/s]
100%|██████████| 3/3 [00:00<00:00, 16.38it/s]
  0%|          | 0/4 [00:00<?, ?it/s]
 75%|███████▌  | 3/4 [00:00<00:00, 16.65it/s]
100%|██████████| 4/4 [00:00<00:00, 14.73it/s]
  0%|          | 0/5 [00:00<?, ?it/s]
 60%|██████    | 3/5 [00:00<00:00, 16.62it/s]
100%|██████████| 5/5 [00:00<00:00, 13.19it/s]
100%|██████████| 5/5 [00:00<00:00, 13.67it/s]
| fit_time | score_time | test_precision | train_precision | test_recall | ... | test_average_precision | train_average_precision | test_log_loss | train_log_loss | n_observations | |||||||||||
|---|---|---|---|---|---|---|---|---|---|---|---|---|---|---|---|---|---|---|---|---|---|
| mean | std | mean | std | mean | std | mean | std | mean | std | ... | mean | std | mean | std | mean | std | mean | std | mean | std | |
| n_features | |||||||||||||||||||||
| 1 | 0.003 | 0.002 | 0.009 | 0.002 | 0.715 | 0.098 | 0.712 | 0.023 | 0.704 | 0.108 | ... | 0.751 | 0.091 | 0.720 | 0.028 | 294.837 | 86.679 | 1,168.535 | 82.092 | 168.000 | 0.000 |
| 2 | 0.002 | 0.000 | 0.009 | 0.000 | 0.687 | 0.066 | 0.687 | 0.021 | 0.713 | 0.099 | ... | 0.765 | 0.078 | 0.755 | 0.023 | 311.417 | 60.820 | 1,234.856 | 84.235 | 168.000 | 0.000 |
| 3 | 0.002 | 0.000 | 0.009 | 0.000 | 0.724 | 0.073 | 0.729 | 0.019 | 0.796 | 0.103 | ... | 0.801 | 0.087 | 0.795 | 0.024 | 262.398 | 61.376 | 1,004.897 | 78.645 | 168.000 | 0.000 |
| 4 | 0.002 | 0.000 | 0.009 | 0.000 | 0.767 | 0.078 | 0.780 | 0.020 | 0.814 | 0.091 | ... | 0.848 | 0.080 | 0.857 | 0.022 | 223.471 | 62.641 | 805.936 | 66.644 | 168.000 | 0.000 |
| 5 | 0.002 | 0.000 | 0.009 | 0.000 | 0.754 | 0.086 | 0.774 | 0.023 | 0.783 | 0.101 | ... | 0.848 | 0.078 | 0.862 | 0.021 | 245.818 | 62.510 | 845.584 | 92.744 | 168.000 | 0.000 |
5 rows × 34 columns
Add AIC and BIC for model selection
| train_neg_AIC | train_neg_BIC | test_neg_AIC | test_neg_BIC | |
|---|---|---|---|---|
| mean | mean | mean | mean | |
| n_features | ||||
| 1 | 2,335.070 | 2,332.173 | 587.674 | 586.148 |
| 2 | 2,465.711 | 2,459.915 | 618.834 | 615.782 |
| 3 | 2,003.794 | 1,995.101 | 518.796 | 514.217 |
| 4 | 1,603.872 | 1,592.281 | 438.941 | 432.836 |
| 5 | 1,681.168 | 1,666.679 | 481.635 | 474.004 |
All cross-validation metrics:
cv_feat = cv_feat.join(IC_criteria)
cv_feat = cv_feat.filter(regex="train|test", axis=1).style.highlight_max(
    axis=0, subset=pd.IndexSlice[:, pd.IndexSlice[:, "mean"]]
)
cv_feat
| test_precision | train_precision | test_recall | train_recall | test_f1 | train_f1 | test_balanced_accuracy | train_balanced_accuracy | test_roc_auc | train_roc_auc | test_average_precision | train_average_precision | test_log_loss | train_log_loss | train_neg_AIC | train_neg_BIC | test_neg_AIC | test_neg_BIC | |||||||||||||||
|---|---|---|---|---|---|---|---|---|---|---|---|---|---|---|---|---|---|---|---|---|---|---|---|---|---|---|---|---|---|---|---|---|
| mean | std | mean | std | mean | std | mean | std | mean | std | mean | std | mean | std | mean | std | mean | std | mean | std | mean | std | mean | std | mean | std | mean | std | mean | mean | mean | mean | |
| n_features | ||||||||||||||||||||||||||||||||
| 1 | 0.715090 | 0.097785 | 0.712124 | 0.022788 | 0.704286 | 0.107999 | 0.707500 | 0.019391 | 0.705759 | 0.088131 | 0.709702 | 0.019351 | 0.748748 | 0.073459 | 0.751437 | 0.016989 | 0.799259 | 0.065666 | 0.798173 | 0.016412 | 0.751101 | 0.091072 | 0.720311 | 0.028466 | 294.837085 | 86.679293 | 1,168.535243 | 82.092116 | 2,335.070486 | 2,332.172646 | 587.674169 | 586.147809 |
| 2 | 0.687396 | 0.066357 | 0.686706 | 0.020643 | 0.712857 | 0.099447 | 0.714286 | 0.024733 | 0.696015 | 0.064919 | 0.700109 | 0.020758 | 0.738534 | 0.053016 | 0.740687 | 0.017950 | 0.807192 | 0.055527 | 0.813695 | 0.013622 | 0.765328 | 0.078350 | 0.754689 | 0.022982 | 311.417165 | 60.820362 | 1,234.855565 | 84.234509 | 2,465.711130 | 2,459.915451 | 618.834331 | 615.781610 |
| 3 | 0.723886 | 0.073140 | 0.728746 | 0.019180 | 0.795714 | 0.103066 | 0.800357 | 0.023846 | 0.752519 | 0.059155 | 0.762733 | 0.018592 | 0.784752 | 0.052193 | 0.793655 | 0.016794 | 0.845158 | 0.058247 | 0.853656 | 0.013804 | 0.800901 | 0.086731 | 0.794904 | 0.023501 | 262.397797 | 61.375810 | 1,004.897056 | 78.644710 | 2,003.794113 | 1,995.100594 | 518.795593 | 514.216512 |
| 4 | 0.767039 | 0.078051 | 0.780211 | 0.020441 | 0.814286 | 0.091268 | 0.837143 | 0.018621 | 0.785609 | 0.061656 | 0.807484 | 0.015171 | 0.815038 | 0.053025 | 0.834130 | 0.013553 | 0.879639 | 0.056085 | 0.896144 | 0.013018 | 0.847946 | 0.080071 | 0.856597 | 0.022011 | 223.470651 | 62.641424 | 805.936090 | 66.644467 | 1,603.872180 | 1,592.280820 | 438.941302 | 432.835860 |
| 5 | 0.753626 | 0.085873 | 0.773605 | 0.022748 | 0.782857 | 0.100974 | 0.821786 | 0.026631 | 0.761591 | 0.063434 | 0.796848 | 0.022512 | 0.794929 | 0.052105 | 0.824919 | 0.019919 | 0.878444 | 0.055807 | 0.900023 | 0.012607 | 0.848134 | 0.077870 | 0.862431 | 0.021129 | 245.817716 | 62.510078 | 845.584109 | 92.743733 | 1,681.168217 | 1,666.679018 | 481.635432 | 474.003630 |
Save:
cv_feat.to_excel(writer, sheet_name="CV", float_format="%.3f")
cv_feat = cv_feat.data
Optimal number of features to use based on cross-validation by metric:
test_average_precision  mean   5
test_balanced_accuracy  mean   4
test_f1                 mean   4
test_log_loss           mean   2
test_neg_AIC            mean   2
test_neg_BIC            mean   2
test_precision          mean   4
test_recall             mean   4
test_roc_auc            mean   4
Name: best, dtype: int64
Retrain model with best number of features by selected metric::
results_model = njab.sklearn.run_model(
    model=model,
    splits=splits,
    n_feat_to_select=n_feat_best.loc["test_roc_auc", "mean"],
)
results_model.name = model_name
  0%|          | 0/4 [00:00<?, ?it/s]
 75%|███████▌  | 3/4 [00:00<00:00, 16.61it/s]
100%|██████████| 4/4 [00:00<00:00, 14.76it/s]
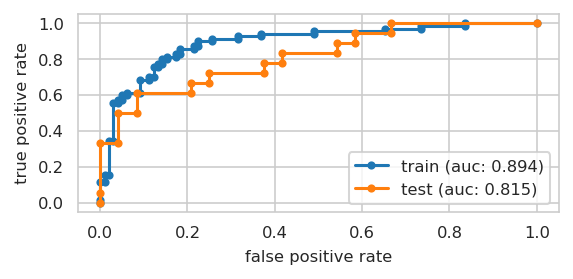
Receiver Operating Curve of final model#
INFO:njab.plotting:Saved Figures to alzheimer/plot_roauc.png
INFO:njab.plotting:Saved Figures to alzheimer/plot_roauc.pdf
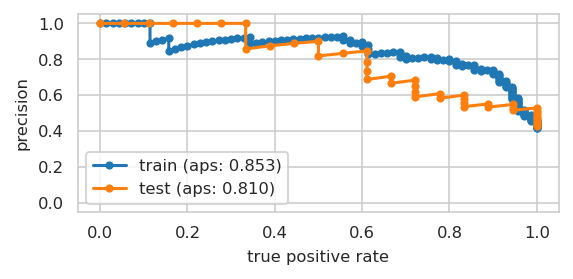
Precision-Recall Curve for final model#
INFO:njab.plotting:Saved Figures to alzheimer/plot_prauc.png
INFO:njab.plotting:Saved Figures to alzheimer/plot_prauc.pdf
Coefficients with/out std. errors#
| coef | name | |
|---|---|---|
| 0 | 1.094 | P63104 |
| 1 | -0.604 | P09486 |
| 2 | -0.791 | A0A0B4J2B5 |
| 3 | 1.129 | P10636-2 |
results_model.model.intercept_
array([-0.25165406])
Selected Features#
| P63104 | P09486 | A0A0B4J2B5 | P10636-2 | |
|---|---|---|---|---|
| count | 168.000 | 168.000 | 168.000 | 168.000 |
| mean | 0.000 | 0.000 | 0.000 | -0.000 |
| std | 1.003 | 1.003 | 1.003 | 1.003 |
| min | -2.527 | -2.578 | -2.756 | -3.959 |
| 25% | -0.721 | -0.648 | -0.660 | -0.483 |
| 50% | -0.108 | 0.101 | -0.060 | -0.021 |
| 75% | 0.756 | 0.540 | 0.693 | 0.549 |
| max | 2.321 | 2.559 | 2.466 | 2.806 |
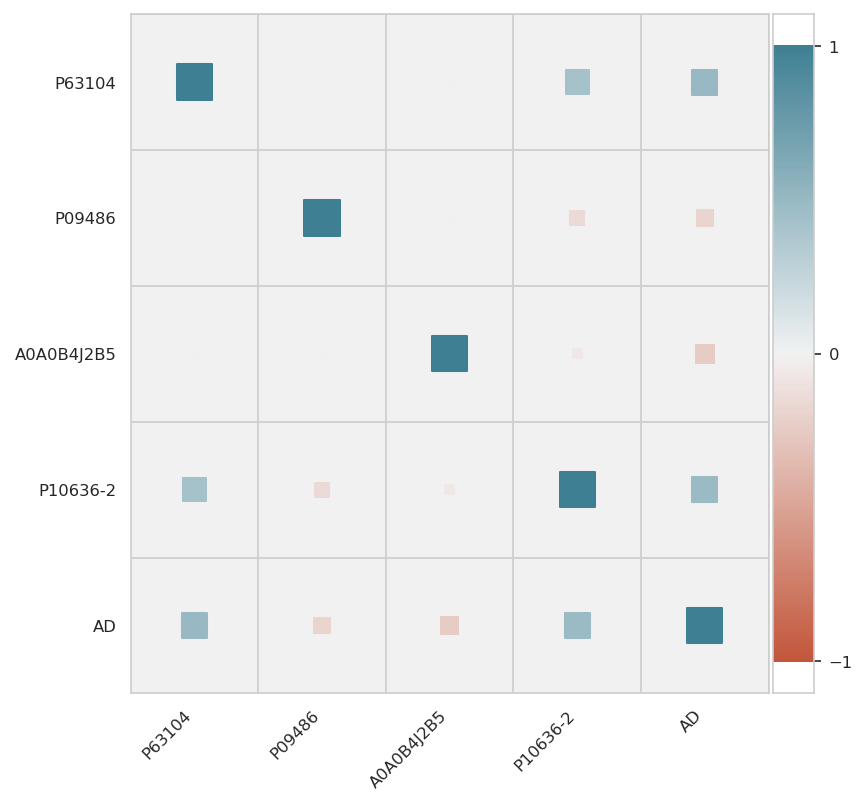
Heatmap of correlations#
INFO:njab.plotting:Saved Figures to alzheimer/corr_plot_train.png
INFO:njab.plotting:Saved Figures to alzheimer/corr_plot_train.pdf
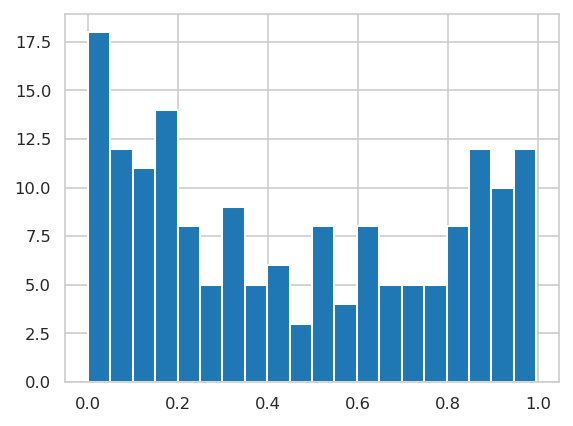
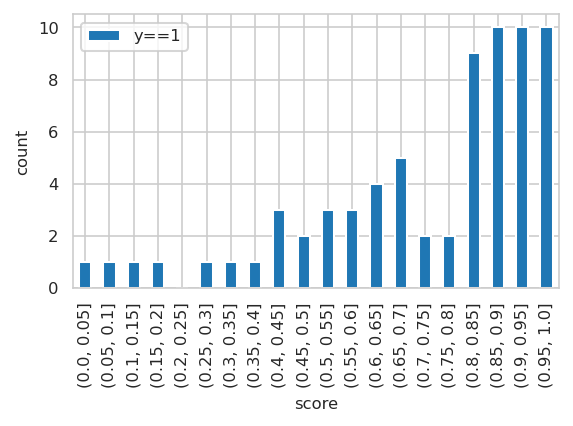
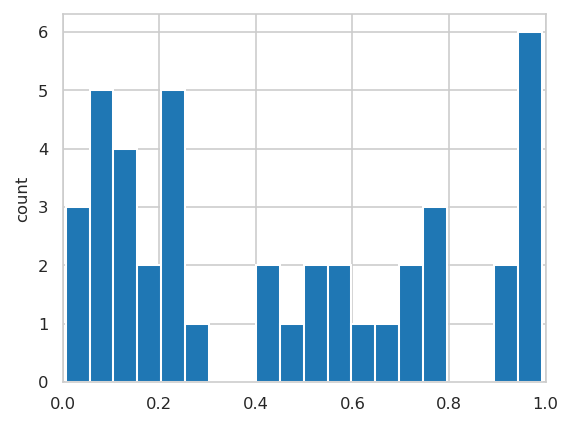
Plot training data scores#
INFO:njab.plotting:Saved Figures to alzheimer/hist_score_train.png
INFO:njab.plotting:Saved Figures to alzheimer/hist_score_train.pdf
INFO:njab.plotting:Saved Figures to alzheimer/hist_score_train_target.png
INFO:njab.plotting:Saved Figures to alzheimer/hist_score_train_target.pdf
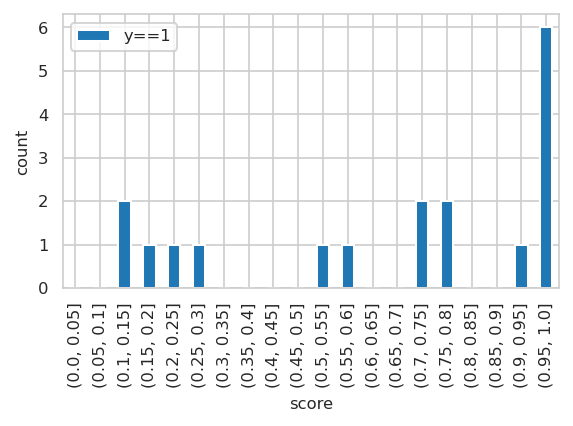
Test data scores#
INFO:njab.plotting:Saved Figures to alzheimer/hist_score_test.png
INFO:njab.plotting:Saved Figures to alzheimer/hist_score_test.pdf
INFO:njab.plotting:Saved Figures to alzheimer/hist_score_test_target.png
INFO:njab.plotting:Saved Figures to alzheimer/hist_score_test_target.pdf
Performance evaluations#
Check if the cutoff can be adapted to maximize the F1 score between precision and recall:
| 0 | 1 | 2 | 3 | 4 | 5 | 6 | 7 | 8 | 9 | ... | 159 | 160 | 161 | 162 | 163 | 164 | 165 | 166 | 167 | 168 | |
|---|---|---|---|---|---|---|---|---|---|---|---|---|---|---|---|---|---|---|---|---|---|
| precision | 0.417 | 0.419 | 0.422 | 0.424 | 0.427 | 0.429 | 0.432 | 0.435 | 0.438 | 0.440 | ... | 0.889 | 1.000 | 1.000 | 1.000 | 1.000 | 1.000 | 1.000 | 1.000 | 1.000 | 1.000 |
| recall | 1.000 | 1.000 | 1.000 | 1.000 | 1.000 | 1.000 | 1.000 | 1.000 | 1.000 | 1.000 | ... | 0.114 | 0.114 | 0.100 | 0.086 | 0.071 | 0.057 | 0.043 | 0.029 | 0.014 | 0.000 |
| cutoffs | 0.000 | 0.004 | 0.009 | 0.010 | 0.011 | 0.011 | 0.014 | 0.023 | 0.028 | 0.032 | ... | 0.962 | 0.970 | 0.976 | 0.980 | 0.983 | 0.987 | 0.989 | 0.993 | 0.995 | NaN |
3 rows × 169 columns
precision   0.741
recall      0.900
cutoffs     0.407
f1_score    0.542
Name: 83, dtype: float64
Cutoff set
0.4065495537928744
| pred - 0.407 | ||
|---|---|---|
| 0 | 1 | |
| true | ||
| 0 | 15 | 9 |
| 1 | 5 | 13 |
| pred - 0.5 | ||
|---|---|---|
| 0 | 1 | |
| true | ||
| 0 | 18 | 6 |
| 1 | 5 | 13 |
Multiplicative decompositon#
Decompose the model into its components for both splits:
| P63104 | P09486 | A0A0B4J2B5 | P10636-2 | intercept | odds | prob | AD | |
|---|---|---|---|---|---|---|---|---|
| Sample ID | ||||||||
| Sample_072 | 6.090 | 1.741 | 3.492 | 7.470 | 0.778 | 215.059 | 0.995 | 1 |
| Sample_086 | 7.186 | 1.516 | 2.847 | 5.633 | 0.778 | 135.787 | 0.993 | 1 |
| Sample_008 | 5.849 | 2.858 | 0.905 | 7.853 | 0.778 | 92.394 | 0.989 | 1 |
| Sample_098 | 6.629 | 1.024 | 1.683 | 8.376 | 0.778 | 74.405 | 0.987 | 1 |
| Sample_071 | 3.086 | 1.321 | 1.870 | 9.578 | 0.778 | 56.749 | 0.983 | 1 |
| Sample_121 | 1.522 | 1.886 | 2.117 | 10.424 | 0.778 | 49.249 | 0.980 | 1 |
| Sample_169 | 1.458 | 1.956 | 3.327 | 5.523 | 0.778 | 40.749 | 0.976 | 1 |
| Sample_092 | 2.613 | 1.021 | 1.957 | 7.900 | 0.778 | 32.072 | 0.970 | 1 |
| Sample_066 | 6.490 | 0.439 | 1.312 | 8.607 | 0.778 | 25.028 | 0.962 | 0 |
| Sample_097 | 3.567 | 2.228 | 3.210 | 1.148 | 0.778 | 22.762 | 0.958 | 1 |
| P63104 | P09486 | A0A0B4J2B5 | P10636-2 | intercept | odds | prob | AD | |
|---|---|---|---|---|---|---|---|---|
| Sample ID | ||||||||
| Sample_018 | 4.648 | 1.233 | 2.615 | 10.706 | 0.778 | 124.817 | 0.992 | 1 |
| Sample_159 | 4.942 | 1.430 | 2.243 | 4.833 | 0.778 | 59.588 | 0.983 | 1 |
| Sample_205 | 2.733 | 0.603 | 3.614 | 9.700 | 0.778 | 44.958 | 0.978 | 1 |
| Sample_099 | 2.494 | 1.938 | 2.383 | 4.474 | 0.778 | 40.066 | 0.976 | 1 |
| Sample_011 | 7.611 | 0.938 | 0.949 | 6.289 | 0.778 | 33.133 | 0.971 | 1 |
| Sample_085 | 2.161 | 1.095 | 1.856 | 5.614 | 0.778 | 19.173 | 0.950 | 1 |
| Sample_112 | 7.952 | 3.326 | 0.722 | 0.833 | 0.778 | 12.369 | 0.925 | 0 |
| Sample_079 | 1.910 | 1.316 | 1.454 | 4.112 | 0.778 | 11.689 | 0.921 | 1 |
| Sample_010 | 5.122 | 0.528 | 0.878 | 1.996 | 0.778 | 3.686 | 0.787 | 1 |
| Sample_133 | 2.978 | 0.822 | 1.741 | 1.034 | 0.778 | 3.427 | 0.774 | 1 |
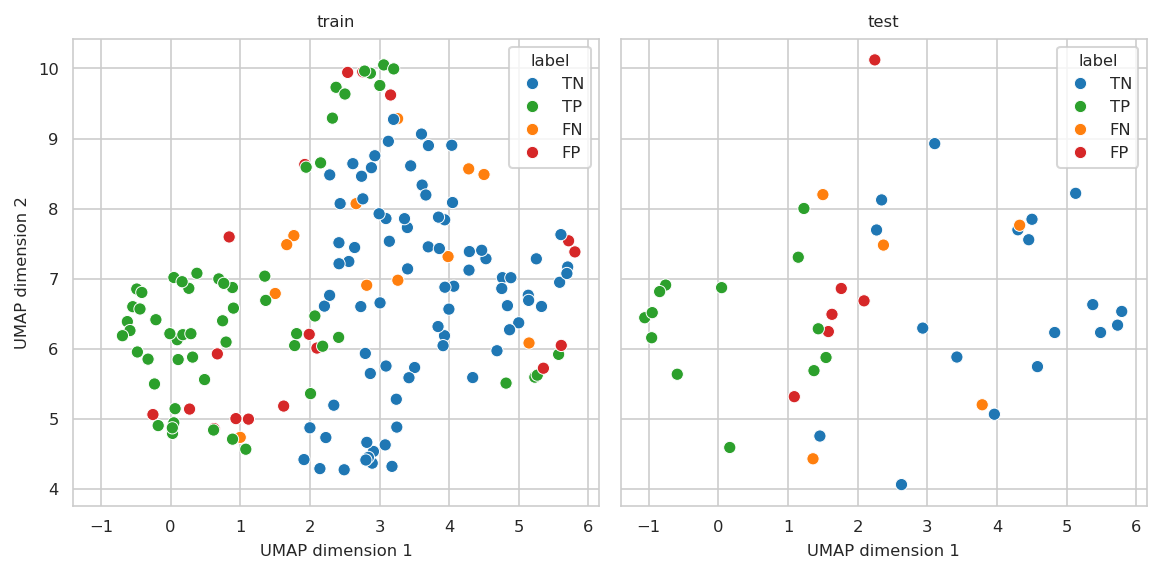
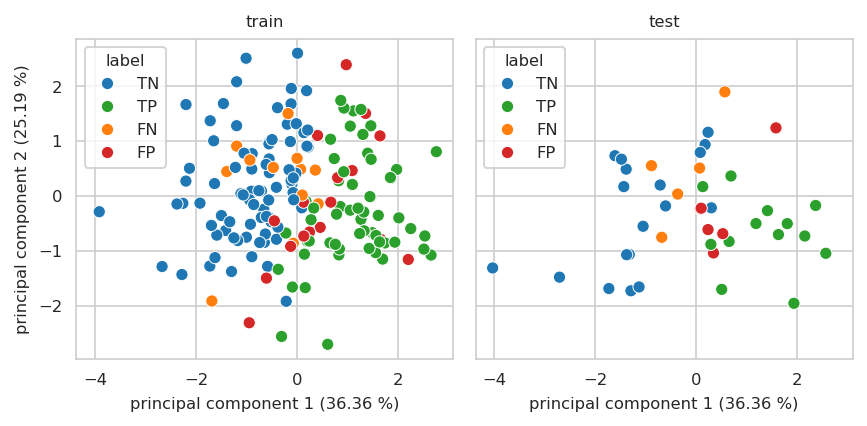
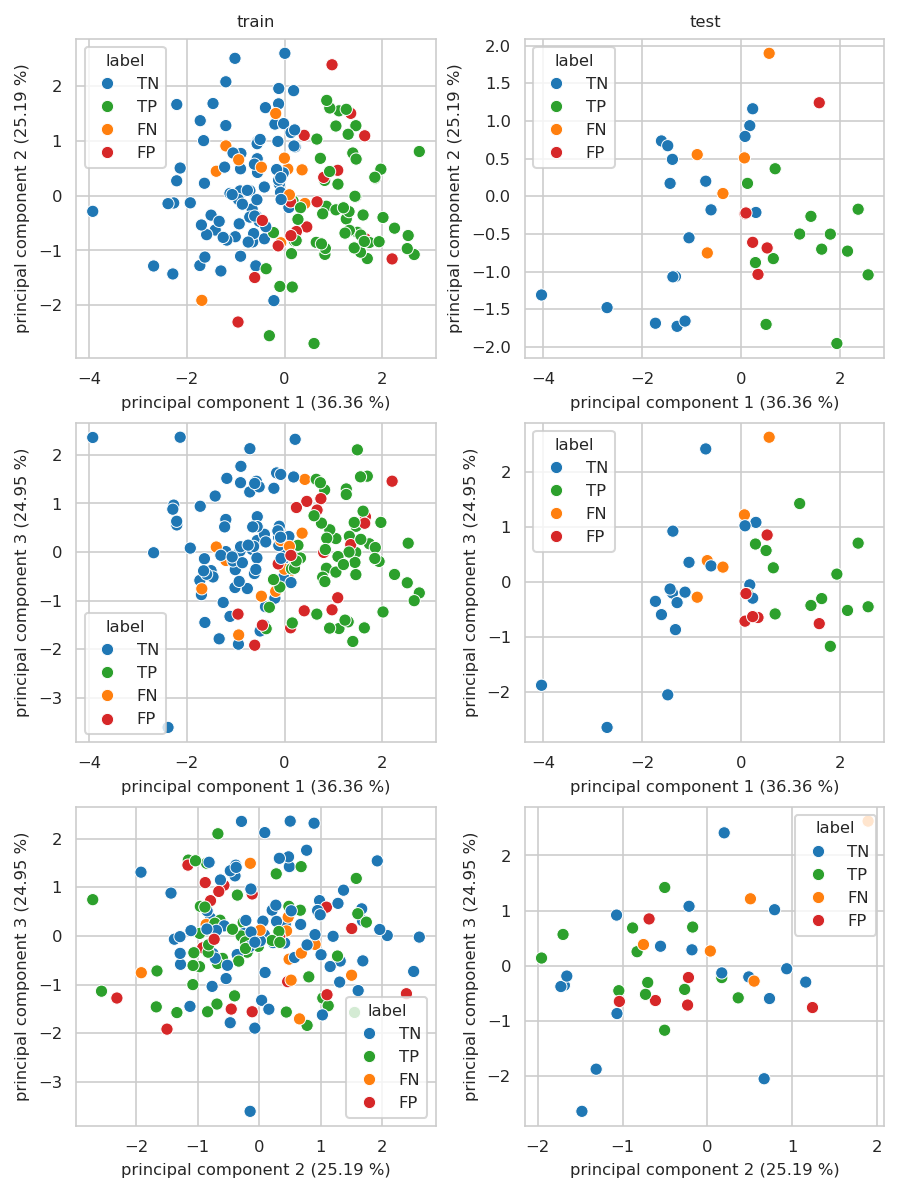
Plot TP, TN, FP and FN on PCA plot#
UMAP#
| UMAP dimension 1 | UMAP dimension 2 | AD | |
|---|---|---|---|
| Sample ID | |||
| Sample_000 | 0.272 | 5.137 | 0 |
| Sample_001 | 1.000 | 4.734 | 1 |
| Sample_002 | 0.797 | 6.094 | 1 |
Annotate using target variable and predictions:
| true | score | all | dead | label | |
|---|---|---|---|---|---|
| Sample ID | |||||
| Sample_018 | 1 | 0.992 | 1 | 1 | TP |
| Sample_159 | 1 | 0.983 | 1 | 1 | TP |
| Sample_205 | 1 | 0.978 | 1 | 1 | TP |
| Sample_099 | 1 | 0.976 | 1 | 1 | TP |
| Sample_011 | 1 | 0.971 | 1 | 1 | TP |
| Sample_085 | 1 | 0.950 | 1 | 1 | TP |
| Sample_112 | 0 | 0.925 | 1 | 0 | FP |
| Sample_079 | 1 | 0.921 | 1 | 1 | TP |
| Sample_010 | 1 | 0.787 | 1 | 1 | TP |
| Sample_133 | 1 | 0.774 | 1 | 1 | TP |
| Sample_127 | 0 | 0.758 | 1 | 0 | FP |
| Sample_090 | 1 | 0.728 | 1 | 1 | TP |
| Sample_156 | 1 | 0.727 | 1 | 1 | TP |
| Sample_145 | 0 | 0.674 | 1 | 0 | FP |
| Sample_186 | 0 | 0.637 | 1 | 0 | FP |
| Sample_067 | 0 | 0.583 | 1 | 0 | FP |
| Sample_060 | 1 | 0.553 | 1 | 1 | TP |
| Sample_197 | 0 | 0.535 | 1 | 0 | FP |
| Sample_146 | 1 | 0.516 | 1 | 1 | TP |
| Sample_009 | 1 | 0.292 | 0 | 1 | FN |
| Sample_194 | 1 | 0.237 | 0 | 1 | FN |
| Sample_142 | 1 | 0.195 | 0 | 1 | FN |
| Sample_171 | 1 | 0.140 | 0 | 1 | FN |
| Sample_125 | 1 | 0.119 | 0 | 1 | FN |
| true | score | all | label | |
|---|---|---|---|---|
| Sample ID | ||||
| Sample_105 | 0 | 0.039 | 0 | TN |
| Sample_204 | 0 | 0.048 | 0 | TN |
| Sample_162 | 0 | 0.159 | 0 | TN |
| Sample_030 | 0 | 0.129 | 0 | TN |
| Sample_126 | 0 | 0.177 | 0 | TN |
INFO:njab.plotting:Saved Figures to alzheimer/umap_sel_feat.png
INFO:njab.plotting:Saved Figures to alzheimer/umap_sel_feat.pdf
Interactive UMAP plot#
Not displayed in online documentation
alzheimer/umap_sel_feat.html
PCA#
INFO:njab.plotting:Saved Figures to alzheimer/feat_sel_PCA_var_explained_by_PCs.png
INFO:njab.plotting:Saved Figures to alzheimer/feat_sel_PCA_var_explained_by_PCs.pdf
Applied to the test split:
| principal component 1 (36.36 %) | principal component 2 (25.19 %) | principal component 3 (24.95 %) | principal component 4 (13.50 %) | |
|---|---|---|---|---|
| Sample ID | ||||
| Sample_009 | 0.065 | 0.509 | 1.214 | -0.950 |
| Sample_010 | 1.181 | -0.502 | 1.419 | -0.297 |
| Sample_011 | 2.363 | -0.173 | 0.701 | -0.049 |
| Sample_018 | 2.564 | -1.044 | -0.453 | 0.327 |
| Sample_038 | 0.173 | 0.937 | -0.055 | -0.153 |
| ... | ... | ... | ... | ... |
| Sample_191 | -2.711 | -1.479 | -2.641 | -1.431 |
| Sample_194 | -0.370 | 0.036 | 0.266 | 0.796 |
| Sample_197 | 0.095 | -0.222 | -0.214 | -0.031 |
| Sample_202 | -1.135 | -1.658 | -0.188 | 0.318 |
| Sample_205 | 1.932 | -1.956 | 0.139 | 0.808 |
42 rows × 4 columns
INFO:njab.plotting:Saved Figures to alzheimer/pca_sel_feat.png
INFO:njab.plotting:Saved Figures to alzheimer/pca_sel_feat.pdf
INFO:njab.plotting:Saved Figures to alzheimer/pca_sel_feat_up_to_3.png
INFO:njab.plotting:Saved Figures to alzheimer/pca_sel_feat_up_to_3.pdf
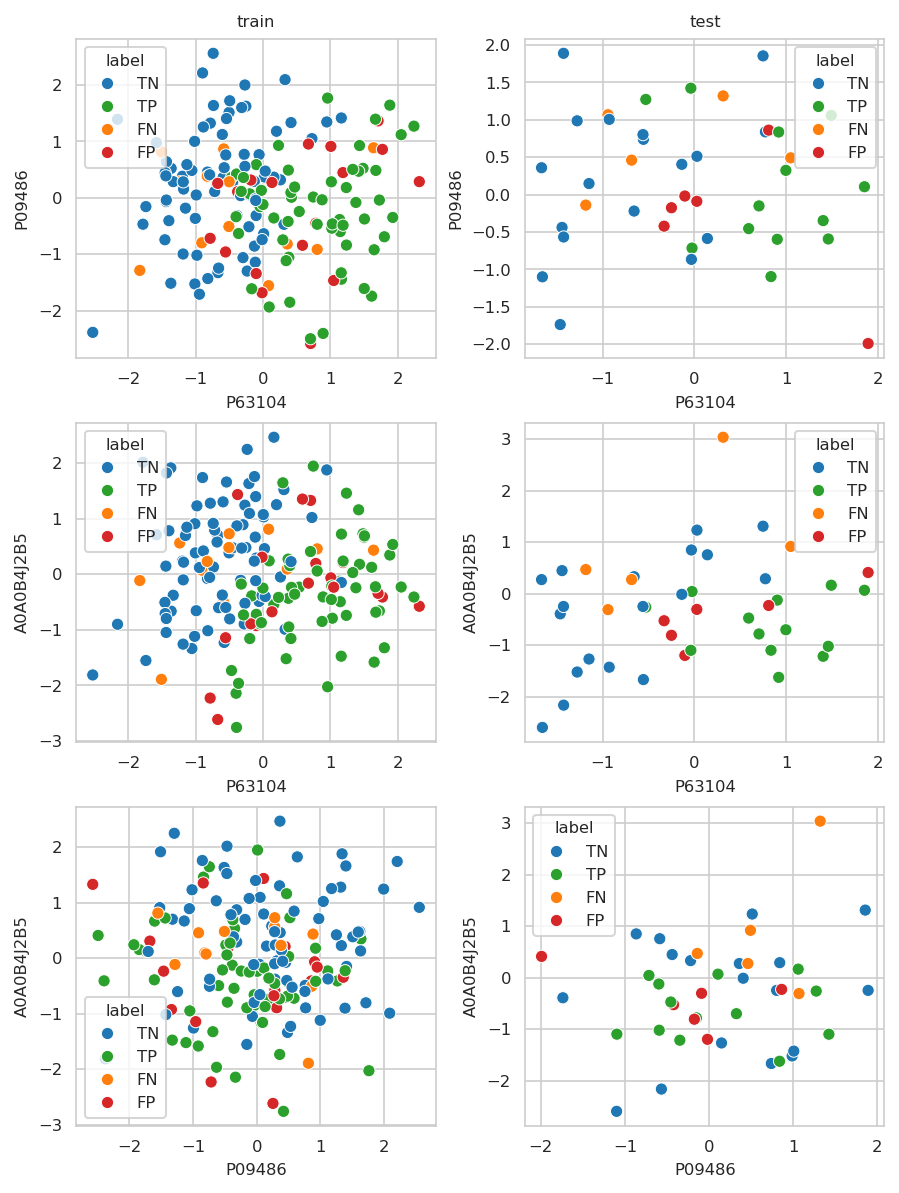
Features#
top 3 scaled n_features_max (scatter)
or unscalled single features (swarmplot)
INFO:njab.plotting:Saved Figures to alzheimer/sel_feat_up_to_3.png
INFO:njab.plotting:Saved Figures to alzheimer/sel_feat_up_to_3.pdf
Savee annotation of errors for manuel analysis#
Saved to excel table.
X[results_model.selected_features].join(pred_train).to_excel(
    writer, sheet_name="pred_train_annotated", float_format="%.3f"
)
X_val[results_model.selected_features].join(predictions).to_excel(
    writer, sheet_name="pred_test_annotated", float_format="%.3f"
)
Outputs#
writer.close()
files_out
{'log_reg': PosixPath('alzheimer/log_reg.xlsx'),
 'var_explained_by_PCs.pdf': PosixPath('alzheimer/var_explained_by_PCs.pdf'),
 'scatter_first_5PCs.pdf': PosixPath('alzheimer/scatter_first_5PCs.pdf'),
 'umap.pdf': PosixPath('alzheimer/umap.pdf'),
 'ROAUC': PosixPath('alzheimer/plot_roauc.pdf'),
 'PRAUC': PosixPath('alzheimer/plot_prauc.pdf'),
 'corr_plot_train.pdf': PosixPath('alzheimer/corr_plot_train.pdf'),
 'hist_score_train.pdf': PosixPath('alzheimer/hist_score_train.pdf'),
 'hist_score_train_target.pdf': PosixPath('alzheimer/hist_score_train_target.pdf'),
 'hist_score_test.pdf': PosixPath('alzheimer/hist_score_test.pdf'),
 'hist_score_test_target.pdf': PosixPath('alzheimer/hist_score_test_target.pdf'),
 'umap_sel_feat.pdf': PosixPath('alzheimer/umap_sel_feat.pdf'),
 'umap_sel_feat.html': PosixPath('alzheimer/umap_sel_feat.html'),
 'feat_sel_PCA_var_explained_by_PCs.pdf': PosixPath('alzheimer/feat_sel_PCA_var_explained_by_PCs.pdf'),
 'pca_sel_feat.pdf': PosixPath('alzheimer/pca_sel_feat.pdf'),
 'pca_sel_feat_up_to_3.pdf': PosixPath('alzheimer/pca_sel_feat_up_to_3.pdf'),
 'sel_feat_up_to_3.pdf': PosixPath('alzheimer/sel_feat_up_to_3.pdf')}